

Once the final official global annual surface temperature is published, 2018 will be the hottest La Niña year on record, by a wide margin. It will be the fourth-hottest year overall, and the fourth consecutive year more than 1°C (1.8°F) hotter than temperatures in the late-1800s, when reliable measurements began. 2009 will be bumped to second-hottest La Niña year on record, at 0.87°C (1.6°F) warmer than the late-1800s, but about 0.16°C (0.29°F) cooler than 2018.
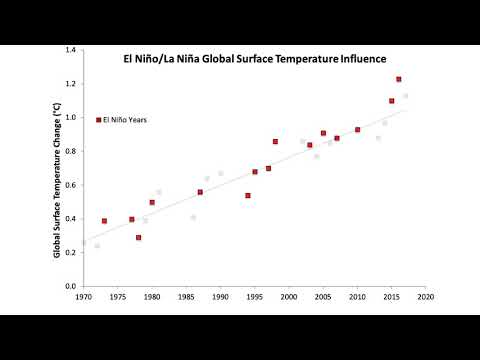
The above brief visual uses NASA GISS global average surface temperature data for 1970–2018, splitting the period into El Niño, Neutral, and La Niña years with linear trends. (Video by Dana Nuccitelli)
El Niño events bring warm water to the ocean surface; La Niña events are cool at the surface. Since scientists measure global surface temperatures over both land and oceans, new hottest year records are usually set during El Niño events.
For this reason, it’s best to compare like-with-like. In the case of 2018, given that it was a La Niña year, it’s most useful to compare it with prior years in which global surface temperatures were cooled by La Niña events.

Defining La Niña years
There is no established scientific definition of a “La Niña year.” To compare apples-to-apples, consider which years had similar surface temperature cooling influences resulting from La Niña events.
To do this, let’s examine the global temperature and El Niño Southern Oscillation (ENSO) data since 1970. That’s the year the Clean Air Act was expanded to authorize regulation of sulfate pollutants that 1) are also released during the burning fossil fuels, and 2) offset global warming by blocking sunlight. Since 1970, emissions of those temperature-cooling pollutants have been reduced even as greenhouse gas levels have continued to rise. As a result, global warming has proceeded rapidly over the past five decades as the increasing greenhouse effect has been unmasked.
There are various indicators of El Niño and La Niña events. There’s the Multivariate ENSO Index (or MEI for short); the Southern Oscillation Index (SOI, which is counter-intuitive in that negative numbers indicate El Niño conditions); and the Oceanic Niño Index (ONI). For our purposes, let’s take the average of the three indices (accounting for the opposite sign of the SOI) and set a cutoff – years with an average index of ± 0.3 are El Niño or La Niña years, and values in the middle represent “neutral” years.
Let’s also separate out “volcanic years,” because large volcanic eruptions like El Chichón in 1982 and Mount Pinatubo in 1991 can release enough sulfate pollution into the atmosphere to significantly block sunlight and cool global surface temperatures for about three years.
Remember too that research scientists Grant Foster and Stefan Rahmstorf in a 2011 study estimated that there’s about a four-month lag before changes in the ENSO cycle are reflected in global surface temperature measurements. So, for example, ENSO changes from September 2017 through August 2018 influence the calendar year 2018 annual global surface temperature.
Using these criteria, since 1970 there have been 15 El Niño years, 15 La Niña years, 13 neutral years, and six volcanic years. 2018 was a fairly weak La Niña year similar to 2009 and 2012, but the global temperature was about 0.16-0.18°C (0.29-0.32°F) hotter in 2018 despite solar activity’s also remaining relatively low.
That last point is important: Those characterized as “climate contrarians” often argue either that the Sun is responsible for global warming, or that an extended quiet solar phase will trigger a “mini ice age.” The fact that record temperatures are occurring while the Sun is in a quiet phase dispels these claims, which have long been disproved by the climate science community.
The global warming trend is clear
The overall global surface warming trend over the past five decades is 0.18°C (0.32°F) per decade. The trends among just El Niño (0.19°C or 0.34°F per decade), neutral (0.17°C or 0.31°F per decade), and La Niña years (0.19°C or 0.34°F per decade) during that period are all very similar.
Over short time intervals of a few years, if there is an abundance of La Niña events, global surface warming will appear to temporarily slow down because La Niña years are cooler than neutral and El Niño years. That happened between 1999 and 2012, when half of those 14 years were cooled by La Niña events. As a result, there were widespread claims that a global warming “pause” or “hiatus” had begun.
Fast forward, and 2014 through 2018 have been the five hottest years ever recorded. Those who proclaimed global warming had stopped or “paused” are now looking rather foolish. That’s because when looking at the big picture, the short-term temperature influences of El Niño and La Niña events cancel each other out, leaving the long-term human-caused global warming trend. That’s the 0.18°C (0.32°F) warming per decade since 1970. “In fact, a new study published in Environmental Research Letters concludes that “there is no statistical evidence for a ‘pause’.”
”Every Click To TweetEvery year now seems to be setting some sort of climate record. 2014 was the hottest year on record despite lacking an El Niño. 2015 quickly smashed that record, only to see it again shattered in 2016. 2017 then beat out 2014 to become the hottest year on record without an El Niño (both were neutral years). And now 2018 has become by far the hottest La Niña year ever recorded.
The data are making it increasingly hard to deny the reality and threats of human-caused climate change and the need for serious actions to address it.